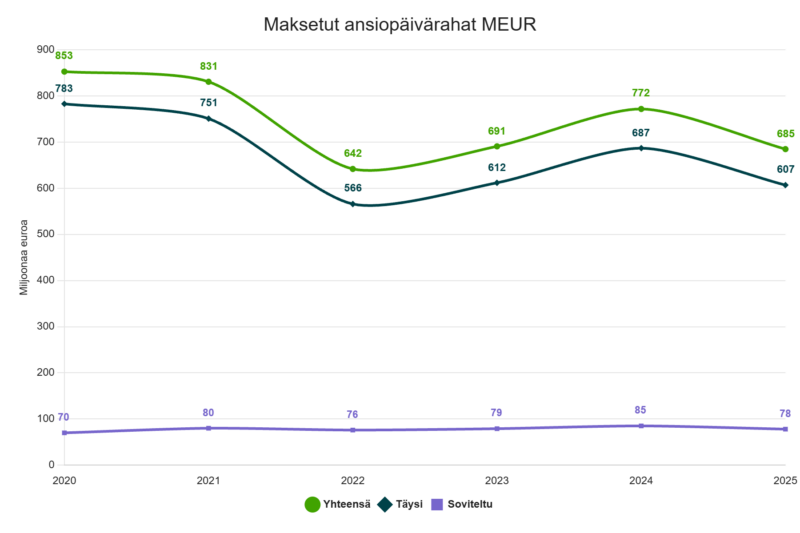
Maksetut ansiopäivärahat MEUR
Spline chart. Data table with 4 rows and 7 columns follows.
| 2020 | 2021 | 2022 | 2023 | 2024 | 2025 | |
|---|---|---|---|---|---|---|
| Yhteensä | 853 | 831 | 642 | 691 | 772 | 685 |
| Täysi | 783 | 751 | 566 | 612 | 687 | 607 |
| Soviteltu | 70 | 80 | 76 | 79 | 85 | 78 |

Spline chart. Data table with 4 rows and 7 columns follows.
| 2020 | 2021 | 2022 | 2023 | 2024 | 2025 | |
|---|---|---|---|---|---|---|
| Yhteensä | 853 | 831 | 642 | 691 | 772 | 685 |
| Täysi | 783 | 751 | 566 | 612 | 687 | 607 |
| Soviteltu | 70 | 80 | 76 | 79 | 85 | 78 |